Another goal for this post is to bring to the light the new features that Google is offering with the online Docs, in this case the Spread Sheet, these are online collaborative work tools that allow several users to edit the same document at same time. what if we can extend this behavior by adding our own scripts and react to specific spread sheet events? as I am talking about issues tracking, the potential users of this are developers! and as a developer I became very happy when I discovered I could do it. It reminds me someway to VBA in Microsoft Office, but saving the distances, of course.
Yes we can add our scripts to Google Docs, for more information about this scripting language see this page https://developers.google.com/apps-script/ Back to our example with the simple issue tracker, scenario: we have a team of four developer that receives the bug list every day and must have up to date the status as closer as possible to real time. Colors for the rows is good for know at glance the status (i.e Red for some issues that are blocked for some reason) and we also want that those blocked or waiting for external information to be at top of this spreadsheet, as well as those already closed or assigned to others to be at bottom.

As a plus, we want also to take advantage of the data validation for the columns such as the developer assigned to the task and the status of the issue, so for solving this we have second sheet (it might be in the same sheet but we don't want to see the list of status nor the developers) where we place those lists and refer to them in the data validation form.
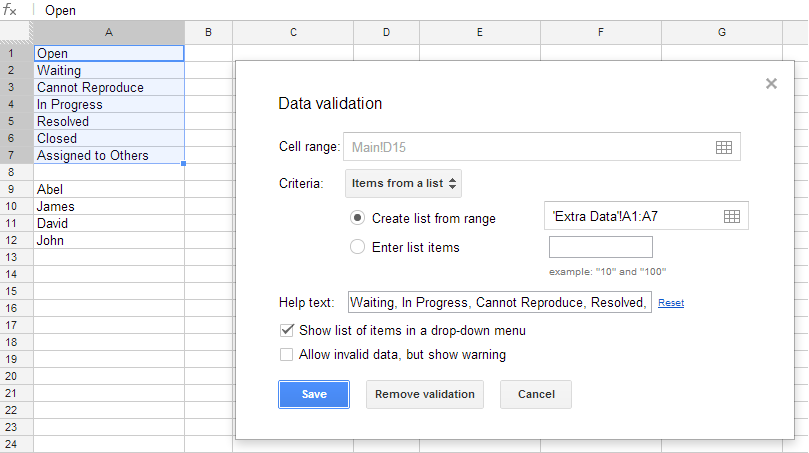
The same procedure for the list of developers. When go to the Tools menu option Script Editor... then get the following dialog

Then choose Spreadsheet and we are ready to start coding, even have some kind of intellisense when typing Ctrl+Space bar, the Help menu is also available and the pages have a lot of documentation with examples.
In this example it has been used the function onEdit which is executed by the spreadsheet after any cell is edited.
The code is quite simple, it determines the data range, loops through every row and set color according to status, cell to cell in the same row, then sorts this range using as criteria the column D values from Z to A so conveniently chosen the status names as we wanted they to be displayed. Here's the whole code
function onEdit(event)
{

  var sheet = SpreadsheetApp.getActiveSheet();
  // just do nothing if not in the right sheet
  if (sheet.getName() != "Main") return;

  var range = sheet.getDataRange();
  var numRows = range.getNumRows();
  var numCols = range.getNumColumns();
  var values = range.getValues();

  // determine the actual amount of data rows
  var actualDataRows = numRows;
  for (var i = 1; i < numRows; i++) {
    if (values[i][0] == "") { // Column A
      actualDataRows = i-1;
      break;
    }
  }

  // for each data row set background color according to status
  for (var i = 1; i < actualDataRows; i++) {
    var cell = values[i][3]; // Column D
    var color = "";
    switch (cell) {
      case "Waiting":
        color = "#ea9999";
        break;

      case "Closed":
        color = "#cccccc";
        break;

      case "In Progress":
        color = "#6D9EEB";
        break;

      case "Resolved":
        color = "#B6D7A8";
        break;

      case "Cannot Reproduce":
        color = "#FFD966";
        break;

      case "Assigned to Others":
        color = "#E69138";
        break;

      default:
        color = "#ffffff";
        break;
    }

    if (color != "") {
      // getRange(row, column, optNumRows, optNumColumns)
      var row = sheet.getRange(i+1, 1, 1, numCols);
      row.setBackgroundColor(color);
    }
  }

  // sort after having changed something
  var tosort = sheet.getRange(2, 1, actualDataRows-1, numCols);
  tosort.sort({column: 4, ascending: false});
  tosort.setBorder(true, true, true, true, true, true);

}
The sample spreadsheet can be found at this link, it's public so anyone can play with it. I hope this text has been useful and encourage you to dig into these scripts capabilities.
thanks man your spreadsheet is useful !!! Do you have some updates of that?.
ReplyDeleteWell thanks for share it!.
There is a great opportunity to sync google callendar with timecamp and have an ability to measure time of tasks from callendar. Did you try this?
ReplyDelete